
The Reports Page gives you a complete overview of your monetization performance. Here, you can track earnings, analyze traffic, and optimize your inventory with real-time data.
Reports are calculated based on GMT+0 and auto-updated every 5 minutes.
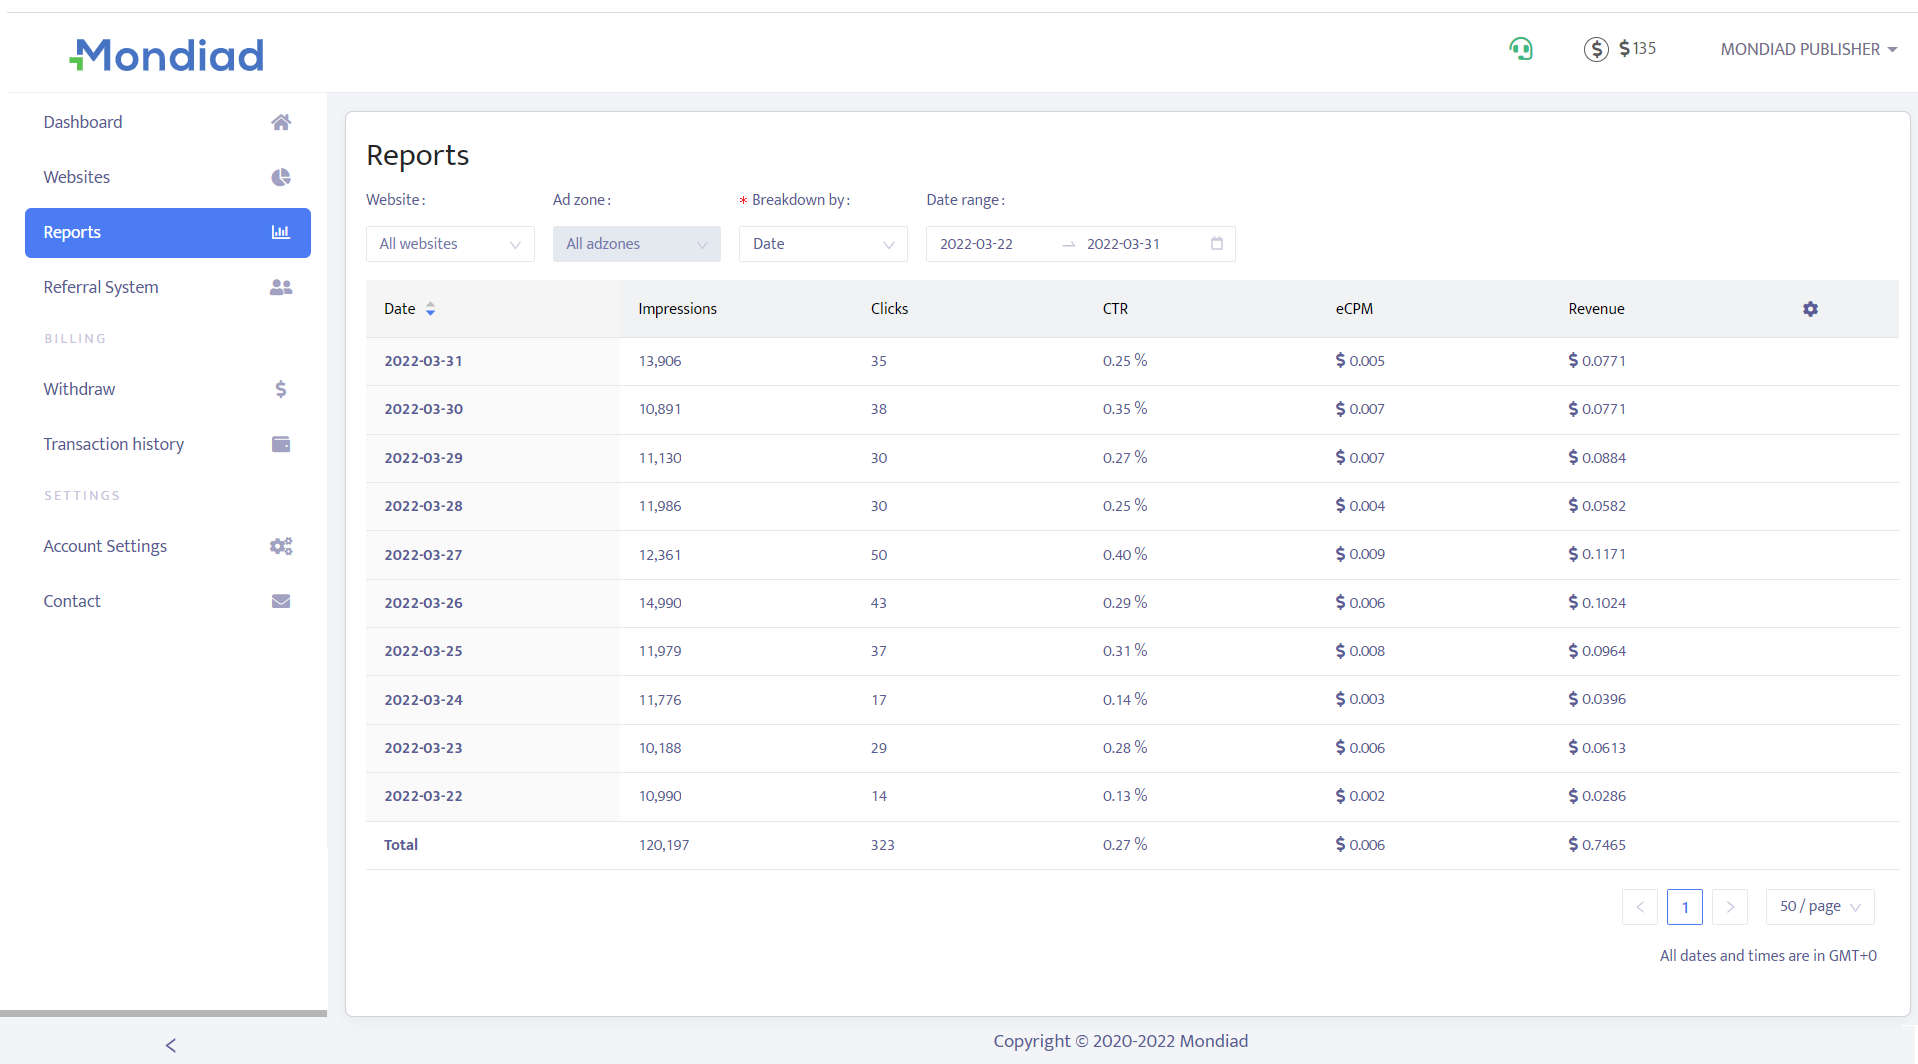
What You’ll Find on the Reports Page
The Reports section provides detailed insights into your activity, including:
Revenue: Total earnings generated from your traffic
Impressions: Number of times ads were displayed
Clicks: User interactions with ads
eCPM: Earnings per 1,000 impressions
CTR: Click-through rate (clicks divided by impressions)
These metrics help you understand how well your inventory is performing.
To change the display of columns by adding or removing them to your liking, click on the gear icon right next to the column titles.
Date Range
Customize your reports to get the data you need:
- Select predefined ranges (Today, Yesterday, Last 7 Days, This Month)
- Set a custom date range
Performance Breakdown
Dive deeper into your data with detailed breakdowns:
- By Zone
Analyze which ad placements generate the most revenue.
- By GEO
See which countries bring the highest returns.
- By Device
Understand how users behave across different devices.
💡 Tip: Use filters to identify your top-performing traffic sources and optimise accordingly.